The Hidden Cost of try-catch
Profiling revealed that using exceptions in C++ for expected control flow can lead to significant performance degradation.
The Problem#
So I was implementing my own version of standard library containers like std::map. It’s a fantastic learning exercise! I get to the operator[], the access-or-insert function. And I was looking at the existing at() method (which provides bounds-checked access) and think, “Aha! I can reuse at() and just catch the exception if the key isn’t there!”
It seems elegant, right? I wrote something like this:
T &at(const Key &key) {
    if (root == nullptr) {
        throw index_out_of_bound();
    }
    return find(key, root);
}

T &operator[](const Key &key) {
    try {
        return at(key);
    } catch (index_out_of_bound &) {
        // insert
        value_type value(key, T());
        pair<iterator, bool> result = insert(value);
        return result.first->second;
    }
}I compile it, feeling pretty good about the code reuse. Then, I run your benchmarks, comparing my sjtu::operator[] against std::map::operator[], especially focusing on scenarios involving insertions (where the key doesn’t initially exist), and boom - Time Limit Exceeded. Why? So I looked at the benchmark script, and it got something like
	//	test: erase()
	while (map.begin() != map.end()) {
		map.erase(map.begin());
	}
	assert(map.empty() && map.size() == 0);
	//	test: operator[]
	for (int i = 0; i < 100000; ++i) {
		std::cout << map[Integer(i)];
	}
std::cout << map.size() << std::endl;So probably you have already identified the problem now, but not so lucky for me. I was just thinking, “Oh, maybe the insert function is slow.”
The Profiling#
The benchmark results are shocking. This implementation is dramatically slower – in my case, it is 88% slower – than std::map specifically when operator[] results in inserting a new element. Accessing existing elements might be fine, but the insert path is killing performance.
What gives? Is your tree balancing algorithm inefficient? Is memory allocation slow? This is where debugging tools become essential. Simple code inspection doesn’t immediately reveal why it’s so much slower as it DO ACHIEVE Time complexity.
Time to bring out the profilers. Tools like perf (on Linux) and callgrind (part of the Valgrind suite) are designed to answer the question: “Where is my program actually spending its time?”
- Beginning with
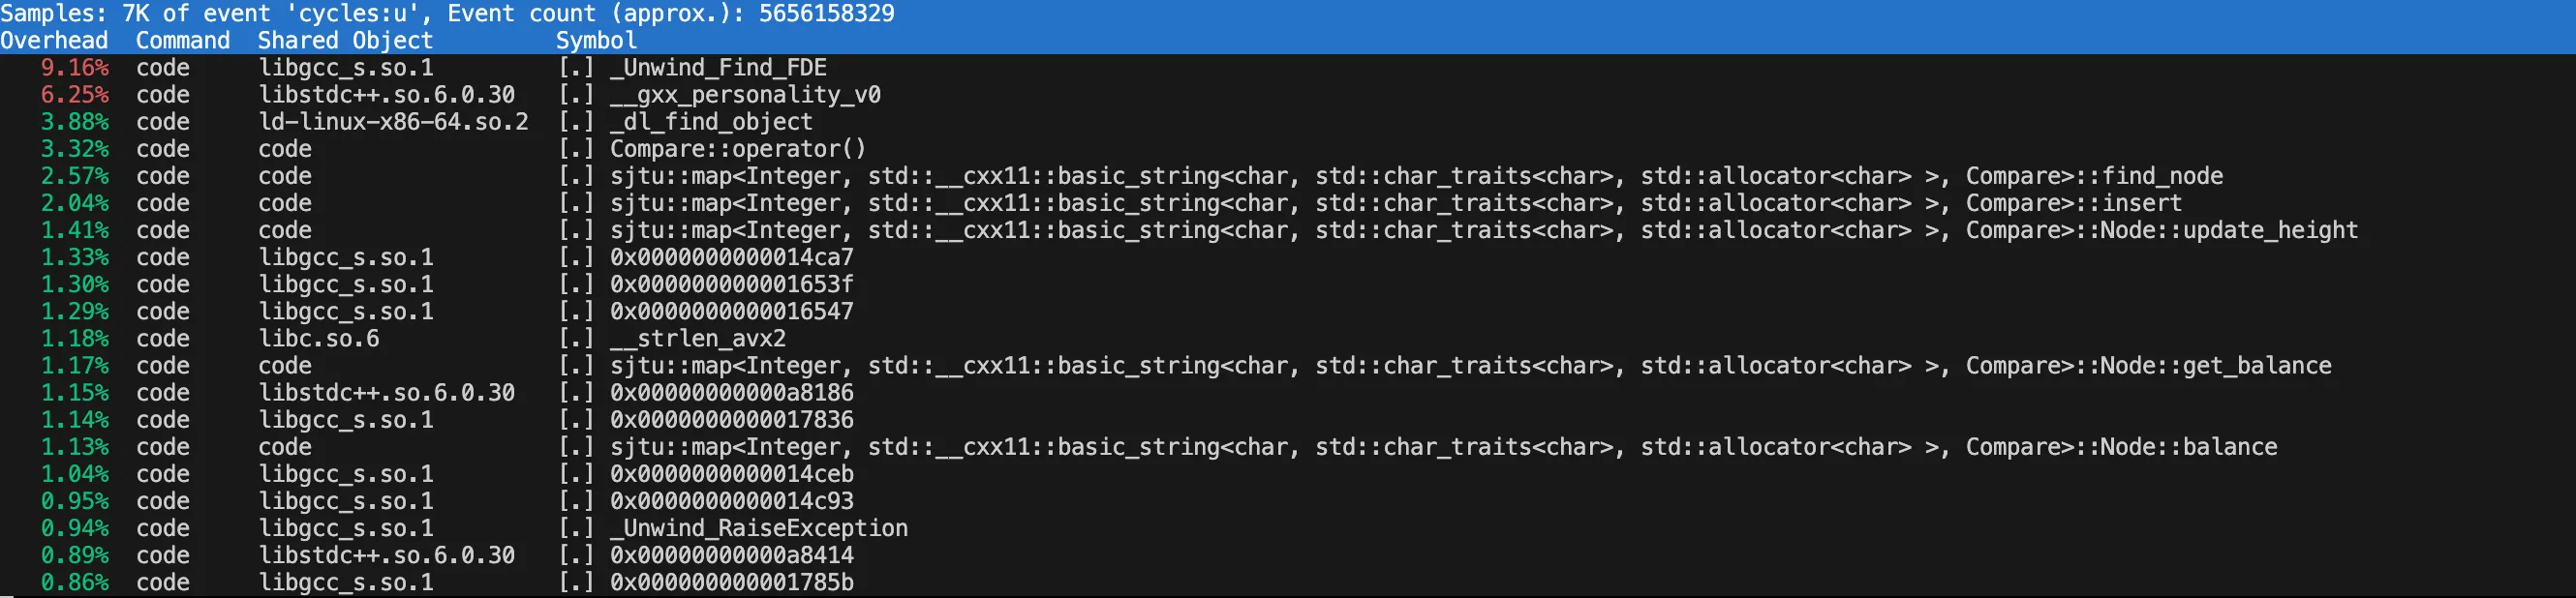
perf record ./codefollowed byperf reportis a great start as it already provides simple CLI views to see which functions are “hot” – consuming the most CPU cycles. Theperf reportpoints towards functions with names_Unwind_Find_FDE, and various functions involved in stack unwinding and exception handling. This already reminded me to focus on some syntax issues (improper coding) instead of my code. However, I’m unfamiliar with something like _Unwind_Find_FDE, so I use callgrind to further view the instruction counts.
- Running
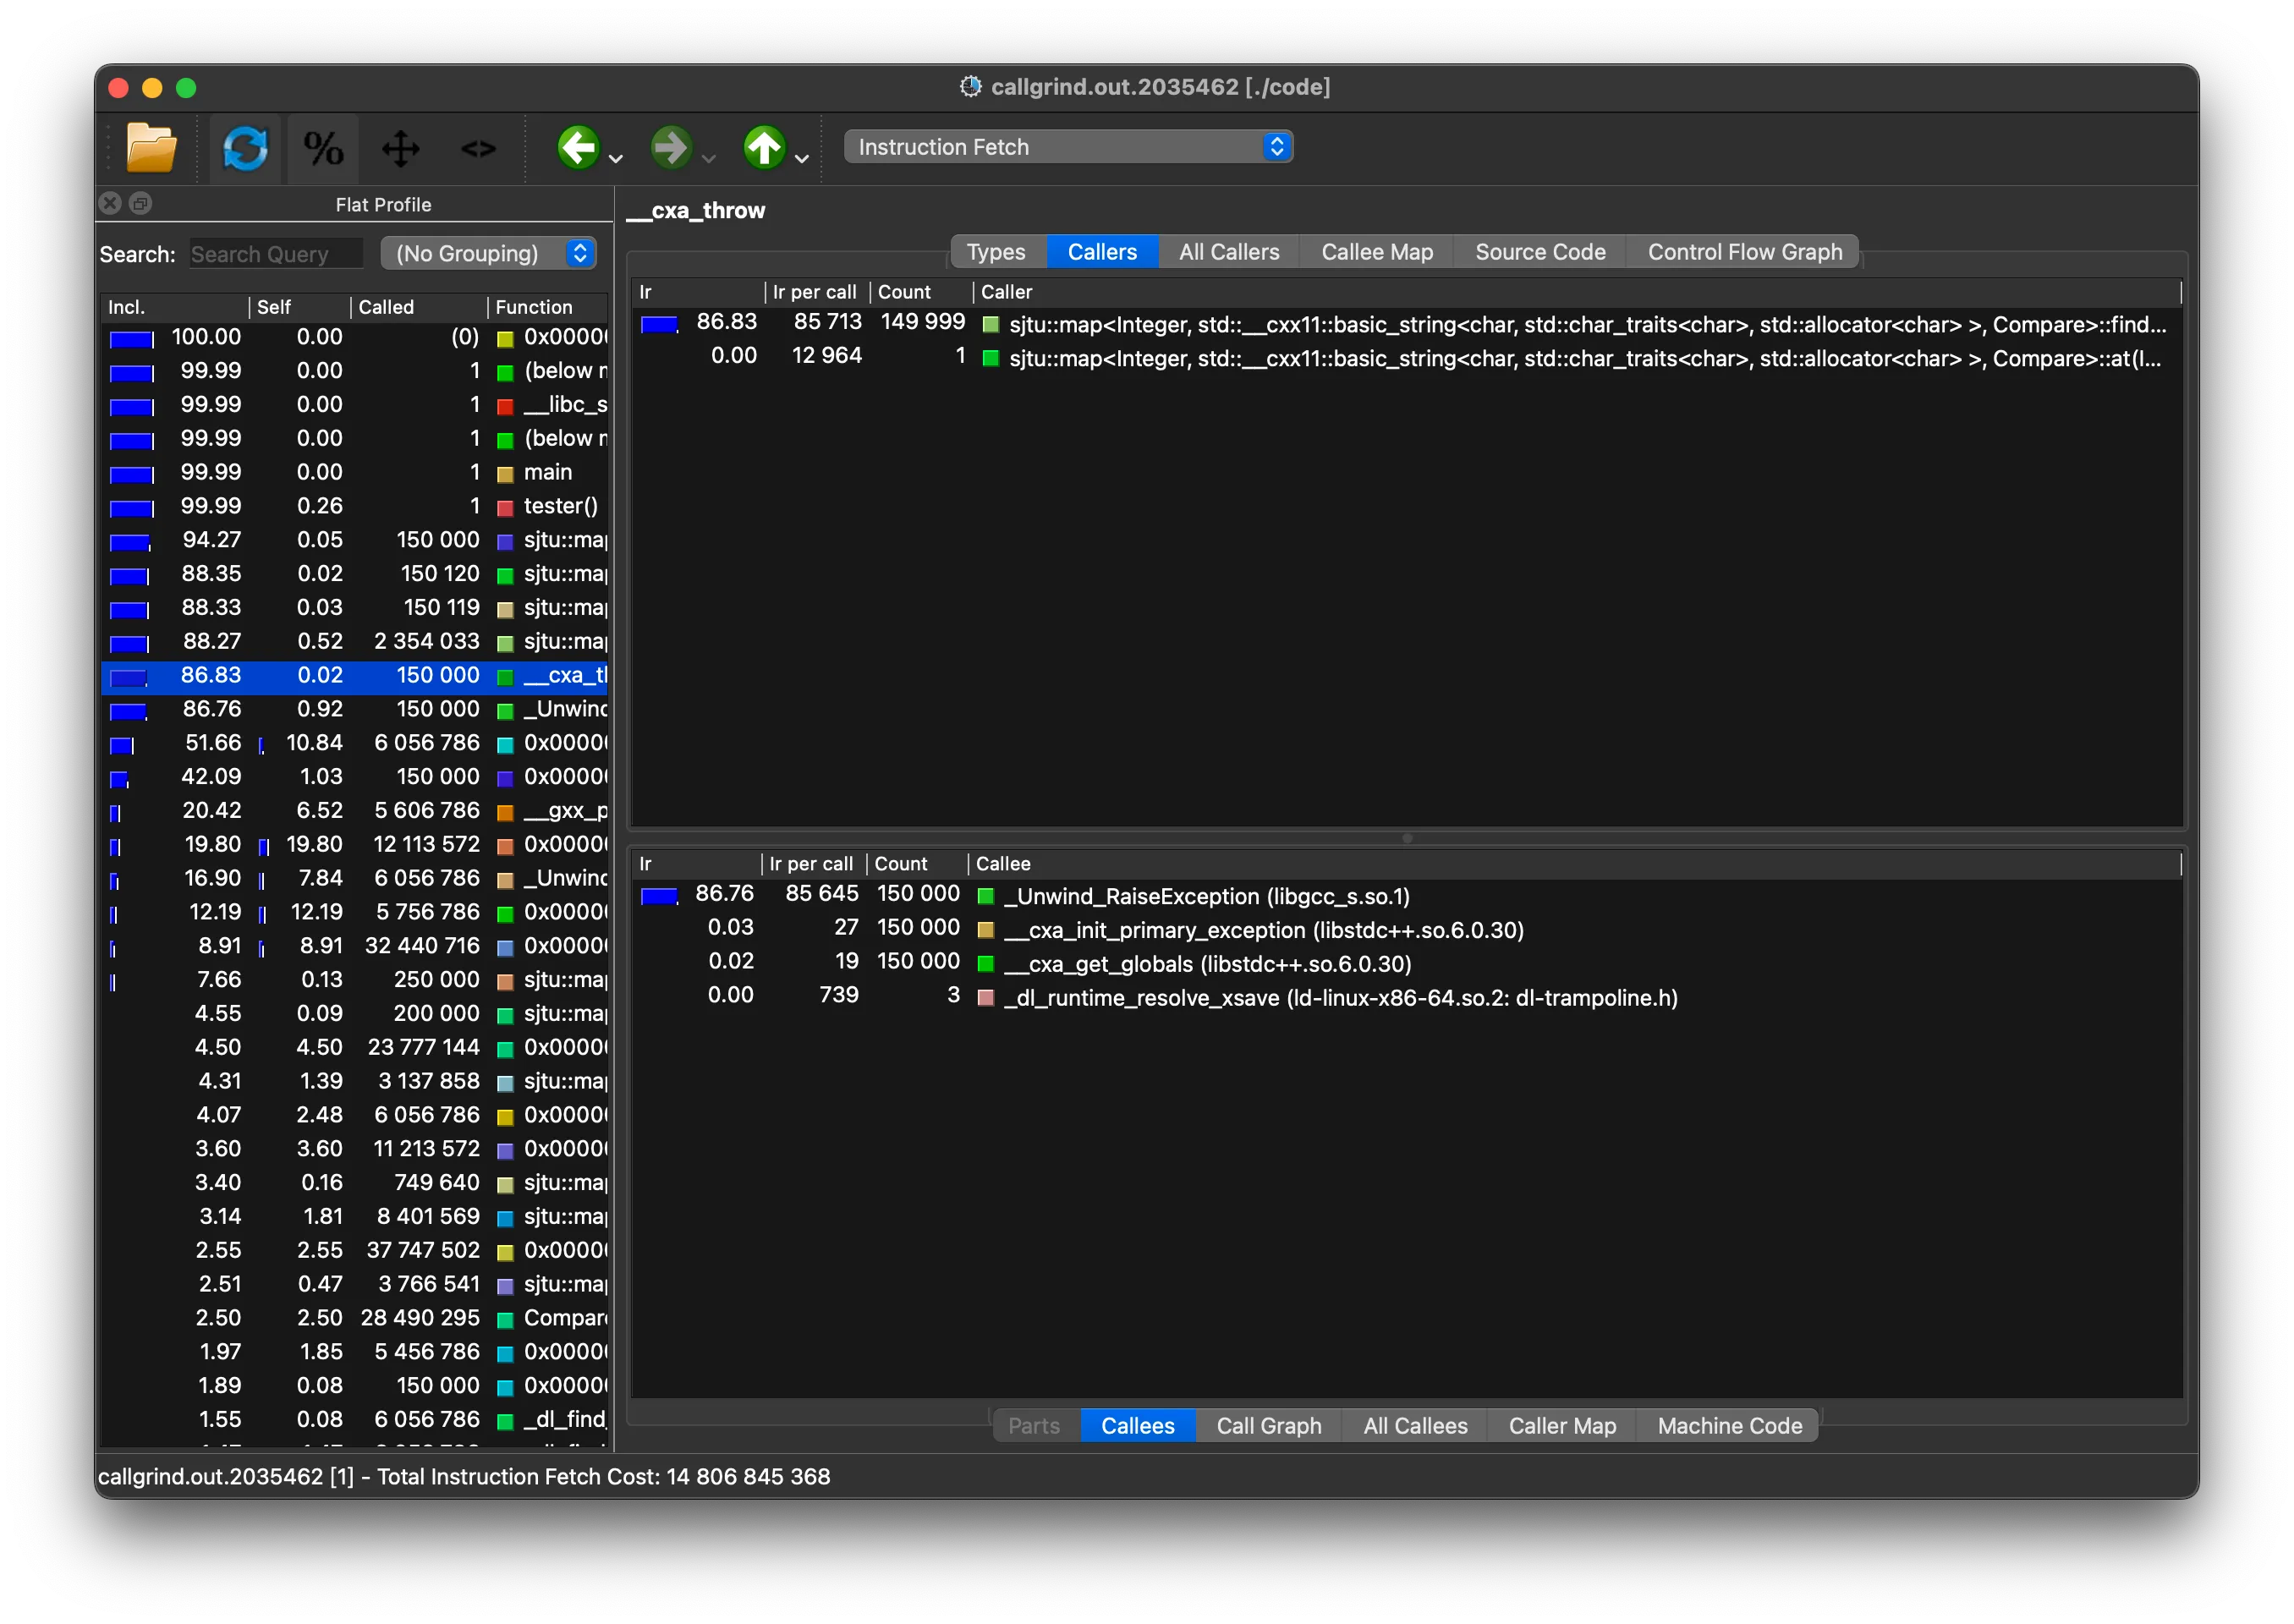
callgrind: I runvalgrind --tool=callgrind ./code. And I am using macOS, so I useqcachegrindto visualize the results.- The visualization confirms
perf’s findings but with more detail. I can see that whensjtu::operator[]callssjtu::atandatexecutesthrow, a massive cascade of function calls related to exception handling follows - costing 87% of execution time!!!!! - Crucially,
callgrindshows the cost associated not just with thethrowitself, but with the entire stack unwinding process – the runtime searching for thecatchblock and meticulously destroying any local objects created within thetryblock and intervening function calls.
- The visualization confirms
The “Aha!” Moment#
The profilers leave no doubt. The performance bottleneck is the deliberate, designed-in overhead of the C++ exception handling mechanism being triggered repeatedly for a non-exceptional condition (key not found during an insertion).
What Actually Happens When C++ Throws an Exception? (And Why Profilers Flag It)#
After chatting with some AI Chatbots and doing some googling, I realize that throwing and catching an exception isn’t just a fancy goto. Instead, it involves a complex runtime process that the profilers pick up as costly operations:
- Exception Object Creation:
throw std::out_of_range(...)creates an object, often involving dynamic memory allocation (heap allocation shows up in profilers). - Stack Unwinding: (The main cost flagged by profilers) The runtime walks backward up the call stack.
- It destroys local objects (RAII cleanup). Profilers show time spent in destructors during unwinding.
- It consults compiler-generated “unwinding tables”. Accessing and processing this data takes time/instructions.
- Handler Matching: The runtime checks
catchblocks using RTTI, adding overhead. - Control Transfer: Jumping to the
catchblock disrupts linear execution flow, potentially causing instruction cache misses and branch mispredictions (subtler effects seen in very low-level profiling).
The profiling results, combined with understanding the mechanics, paint a clear picture:
- Stack Unwinding Overhead: As
callgrindshowed, walking the stack, looking up cleanup actions, and calling destructors is expensive, especially compared to a simpleifcheck. - Runtime Machinery: The hidden machinery (dynamic allocation, RTTI, table lookups) adds significant overhead absent in direct conditional logic.
- Optimization Barriers: Exception handling constructs can limit compiler optimizations compared to simpler control flow, contributing to higher instruction counts seen in
callgrind.
In our operator[] example, the case where the key doesn’t exist is expected. By using exceptions here, we frequently trigger the heavyweight process the profilers flagged, leading to poor performance.
So what does a normal operator[] look like? It should be something like this:
    T &operator[](const Key &key) {
        Node *node = find_node(key, root);
        if (node != nullptr) {
            return node->data.second;
        } else {
            // Insert new element
            value_type value(key, T());
            pair<iterator, bool> result = insert(value);
            return result.first->second;
        }
}and the profiler results should look like something like this:
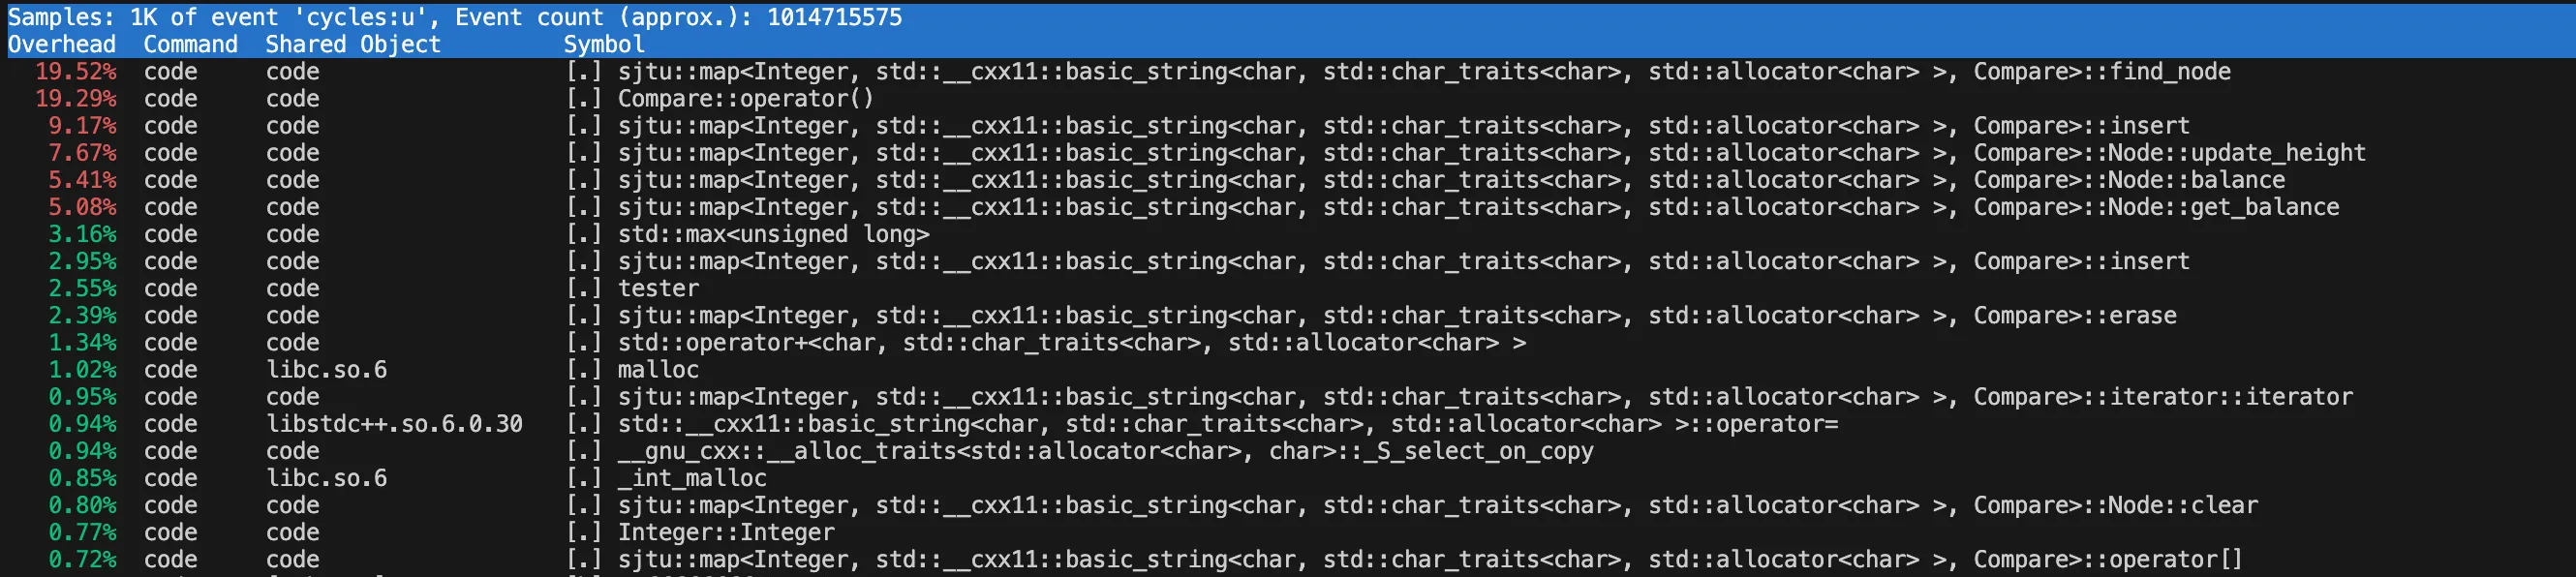
As you can see in the image, the top CPU-consuming functions are now actual function in the code, not the exception handling machinery. The find_node function is now the most expensive operation, which is expected since it involves
tree traversal.